Quinton Barrett and Jay Green of People Element join us to talk about measuring employee engagement, collecting data and the importance of sharing it, and how Nussbaum measures up.

Who Is People Element
People Element specialize in partnering with businesses and organizations to help them build on their most crucial asset… their people. They offer many services from personality assessment to new hire onboarding, employee engagement surveys, and more.
Nussbaum partners with People Element to conduct an annual employee engagement survey. People Element provides an excellent way for us to allow employees to share their thoughts and opinions anonymously so that we can get an accurate measure of how engaged employees are and see what we can focus on to improve as a company.
How Do the Surveys Work
If you’ve ever taken a survey at all, chances are you have answered questions utilizing something known as the Likert Scale. You know, the questions that ask you to rate whether you agree, or disagree with a statement on a 5 point scale.
People Element designs a survey using the Likert scale combined with positive, to-the-point statements/questions about every part of the business. They then administer the survey by providing employees with both online and phone-based means to participate. The goal is not only to measure where the company stands but to determine what drives engagement at the company and in what can be done to help bring engagement up. Then share the results with the whole company to help drive transparency at every level.
“We can say Nussbaum is 80% engaged and maybe that’s helpful, but what’s really helpful is that we ask a lot of other questions that can help us determine what drives engagement.”
Quinton Barrett
How Does Nussbaum Measure Up
“There is no way to say it without it sounding really
Quinton Barrettgood, because it is.”
To hear Quinton and Jay talk about Nussbaum’s numbers, one might think there is nowhere to go but down. In fact, Quinton admits to saying as much after last year’s survey. Yet we continue to evaluate and make incremental improvements each year.
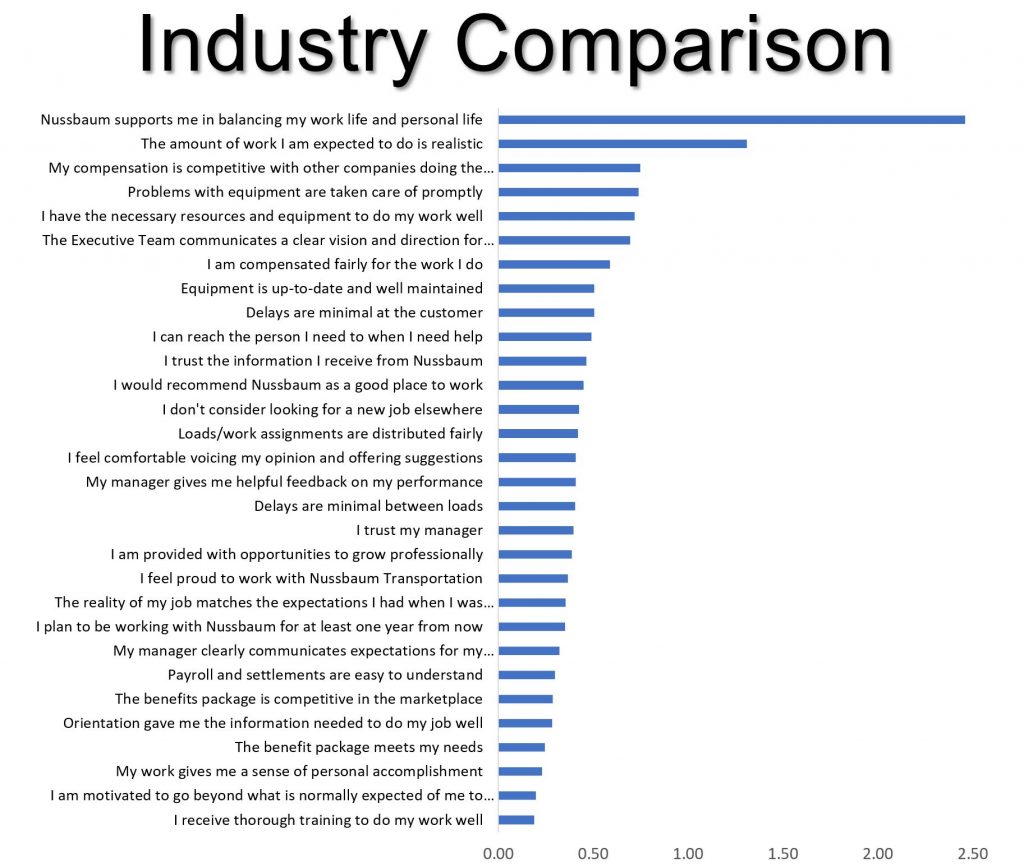
Quinton highlights how we stack up on some of the standard questions they use industry-wide and notes how we tend to score above average.

Lines represent the difference between Nussbaum scores and the Industry Benchmark per question. Blue is above average and red is below.
We think these results are pretty impressive and tell the story of a workforce who are passionate about what they do and want to be an active part of building a great company.
But this is only a small part of the picture. There are always things we can work on and be better at. So we dig into the data to identify those weaker spots and take action over the year.
“It would be really easy to say we have 89% favorable data, we’re doing good… but I think where you get the most value is saying… what categories are below 89%, lets see if we can get those up into that 90% favorable percentile.”
Quinton Barrett
Links

